We use cookies to understand how you use our site and to improve the overall user experience. This includes personalizing content and advertising. Read our
Privacy Policy
At Profacgen, our eCLIP-Seq (enhanced Cross-Linking Immunoprecipitation Sequencing) service covers all the essentials-from prepping your samples and doing UV cross-linking and immunoprecipitation, to enriching and purifying RNA, building libraries, running the sequencing, and diving deep into data analysis. Our hands-on team will be with you every step of the way, helping you design your experiment and make sense of the data, so you get reliable, actionable results. Whether you're looking at RNA processing, hunting for miRNA targets, or figuring out how RNA-binding proteins work, our service is designed to give your research the boost it needs.
Fig1. Schematic Diagram of EMSA.
What is eCLIP-seq?
eCLIP-Seq takes classic CLIP methods a step further, offering better resolution and efficiency for pinpointing the RNA targets of binding proteins. It mixes UV cross-linking with immunoprecipitation and high-throughput sequencing to map binding sites across the whole RNA transcriptome, covering introns, exons, and non-coding RNAs. This method really stands out from other clip-seq techniques by clearly showing where proteins interact with RNA, boosting the connection between them, and making it easier to identify binding sites across different regions like the 3'-UTR and 5'-UTR.
Fig2. Diagram illustrating the principle of eCLIP-seq. (Zhu.; et al. Mol Plant. 2020)
Advantages of eCLIP-Seq
High-Resolution Mapping
eCLIP-Seq pinpoints the exact spots where RNA-binding proteins stick to the transcriptome-covering introns, exons, and non-coding RNAs-with great precision.
Enhanced Efficiency
This approach ramps up ligation efficiency while cutting down on PCR duplicate reads, which really boosts both throughput and accuracy.
Safety and Convenience
By steering clear of radioactive markers, eCLIP-Seq offers a safer, more user-friendly alternative to the traditional CLIP methods.
Detection of Transient Interactions
Thanks to UV cross-linking, it catches even fleeting RNA-protein interactions, giving you a clear picture of dynamic regulatory processes.
Comprehensive Data Analysis
Profacgen provides in-depth analysis, including quality control, sequence alignment, peak calling, GO and KEGG pathway analysis, and motif identification, so you end up with solid, usable results.
Versatile Applications
Whether you're working with common cell lines or model organisms, eCLIP-Seq adapts smoothly to a wide variety of biological samples.
Full Process Service: We offer both full eCLIP execution and dedicated data analysis for your own datasets. Just reach out if you'd like us to process your data.
Comprehensive Reporting: Our detailed reports come with original raw sequences, refined optimized files, and a wealth of enriched peak data, giving you deep insights into your results.
Standardized Library Sequencing: Using our eCLIP-Seq method, libraries are sequenced under standard SE50 or SE75 conditions on Illumina HiSeq or Novaseq, ensuring consistent and reliable data.
Proven Antibody Selection: Choose from our verified antibodies, including DYKDDDDK and MYC, for accurate labeling and dependable results.
Wide Sample Compatibility: Our eCLIP-seq service works seamlessly with common cell lines, model organisms, and a broad range of other biological samples. Please contact us for more information.
Rapid Turnaround & Quality Assurance: Profacgen's service prides itself on a short project cycle and high-quality standards, helping you move forward quickly with confidence.
Case Study
Project: eCLIP-Seq on WT & Mutant X
Background
The goal of this project is to deliver the eCLIP-Seq results of WT drosophila ovary and mutant X to the customer. The project involves tissue lysis, RNase digestion, immunoprecipitation, RNA library construction, sequencing, and bioinformatics analysis.
Results
Data Quality Control: The raw data was preprocessed to obtain clean data, and quality control was performed using FastQC software.
Fig3. Quality scores Per base sequence quality.
Reference Sequence Alignment (Reads Mapping) Statistics: The mapped reads rate was evaluated, indicating the quality of the sequencing data.
Table 1 Statistics of reference sequence alignment results.
sample names
number of input reads
Average input read length
Mapped reads number
Mapped reads%
Average mapped length
Number of splices: Total
Control-Input_PE.Control-Input.NIL
2798063
96
405572
14.50%
114.92
10227
Control-IP_PE.Control-IP.bc1
204205
127
80042
39.20%
140.44
132
Control-IP_PE.Control-IP.bc2
119849
134
34822
29.06%
142.14
84
Mutant-Input_PE.Mutant-Input.NIL
2870779
125
990023
34.49%
129.69
37404
Mutant-IP_PE.Mutant-IP.bc1
344856
119
173294
50.25%
129.4
267
Mutant-IP_PE.Mutant-IP.bc2
160347
124
74074
46.20%
131.59
182
IGV Visualization: The enrichment of reads in the genome was visualized, providing insights into the binding sites.
Fig4. IGV visual display.
Peak Analysis Statistics: A total of 125 peaks were identified in the control sample and 590 peaks in the mutant sample.
Table 2 Peak Calling Result Statistics.
Sample
Peak number
Control.compress.bed
125
Mutant.compress.bed
590
Peak Annotation Distribution: The peaks were distributed across various genomic regions, with a focus on promoter and TSS regions.
Fig5. Peak annotation distribution.
Motif Analysis: Specific motifs were identified, providing reference for subsequent research.
Fig6. Motif analysis.
GO Enrichment Analysis of Genes: GO enrichment analysis revealed the distribution of genes in different functional categories.
Fig7. GO enrichment analysis diagram.
FAQs
Q: How do I get started with eCLIP-seq services?
A: To get started, simply:
Contact us to discuss your project requirements.
Submit your samples along with a completed project submission form.
Receive a detailed project timeline and cost estimate.
Let our team handle the rest, from experimental execution to data delivery.
Q: Can eCLIP-seq be combined with other omics technologies?
A: Yes, eCLIP-seq can be integrated with other omics approaches, such as:
RNA-seq: To correlate RNA-protein interactions with gene expression changes.
RIP-seq: For complementary validation of RNA-protein interactions.
ChIP-seq: To study DNA-protein interactions in parallel.
Proteomics: To identify co-factors or additional proteins in RNA-protein complexes.
Q: Can eCLIP-seq be used to study specific RNA-binding proteins (RBPs)?
A: Yes, eCLIP-seq is highly effective for studying specific RBPs. Our service includes:
Custom antibody validation to ensure specificity for your target RBP.
Optimization of crosslinking and immunoprecipitation conditions for your protein of interest.
Identification of binding sites and functional analysis of the RBP's target RNAs.
Q: How long does the eCLIP-seq service typically take, and what is the turnaround time?
A: The turnaround time for eCLIP-seq services depends on the project scope, including sample preparation, library construction, sequencing, and data analysis. On average, the process takes 6-8 weeks from sample receipt to final report delivery. Expedited services may be available upon request.
Ule J.; et al. CLIP identifies Nova-regulated RNA networks in the brain. Science. 2003;302(5648):1212-1215.
Van Nostrand EL.; et al. Robust transcriptome-wide discovery of RNA-binding protein binding sites with enhanced CLIP (eCLIP). Nat Methods. 2016;13(6):508-514.
Online Inquiry
Fill out this form and one of our experts will respond to you within one business day.
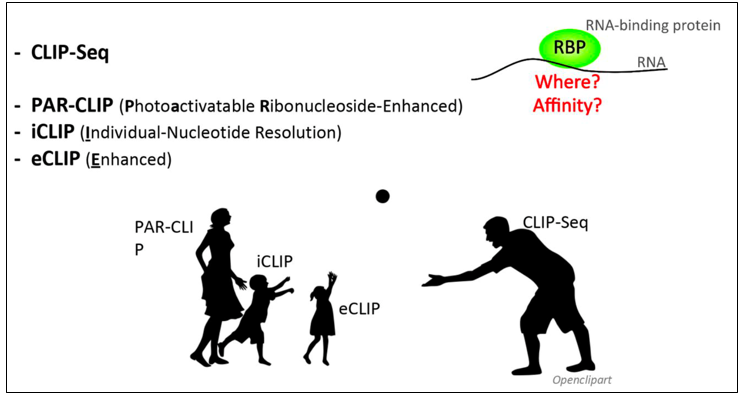 Fig1. Schematic Diagram of EMSA.
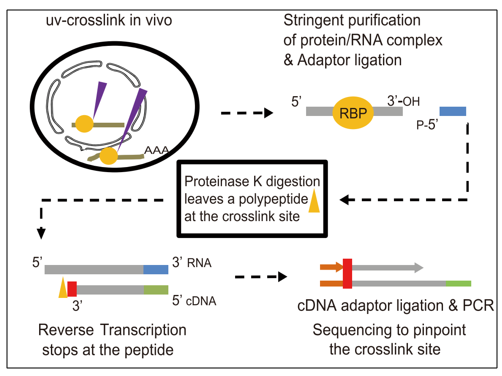 Fig2. Diagram illustrating the principle of eCLIP-seq. (Zhu.; et al. Mol Plant. 2020)
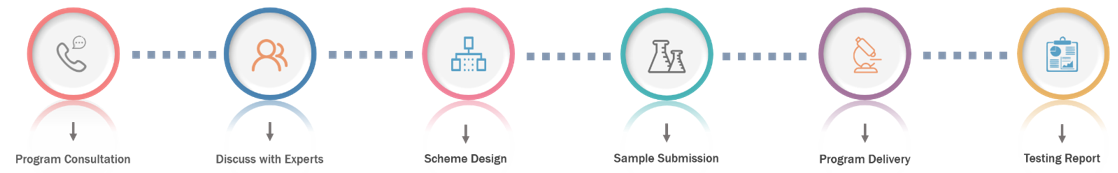
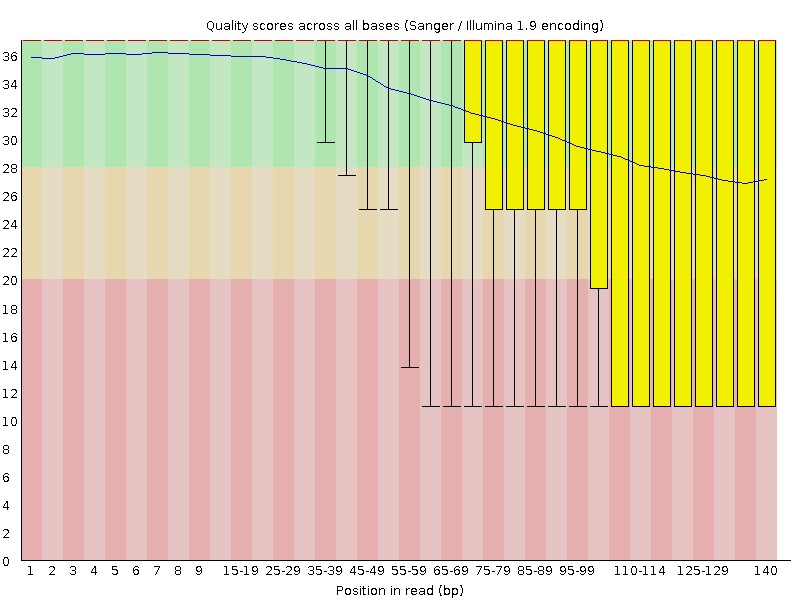 Fig3. Quality scores Per base sequence quality.
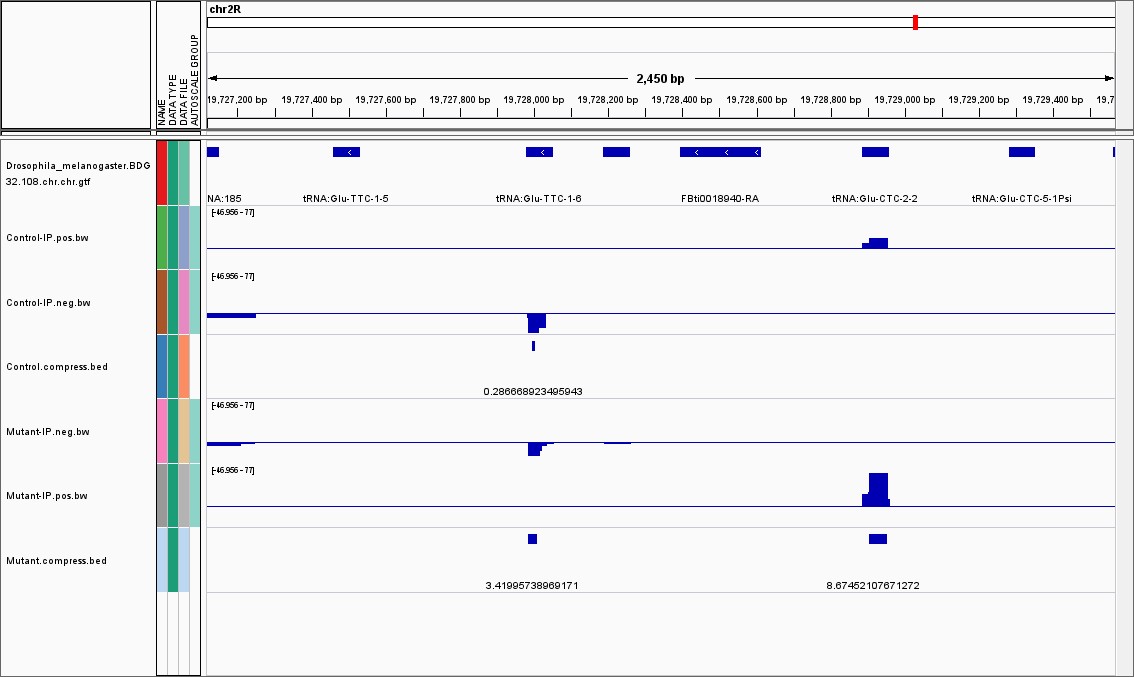 Fig4. IGV visual display.
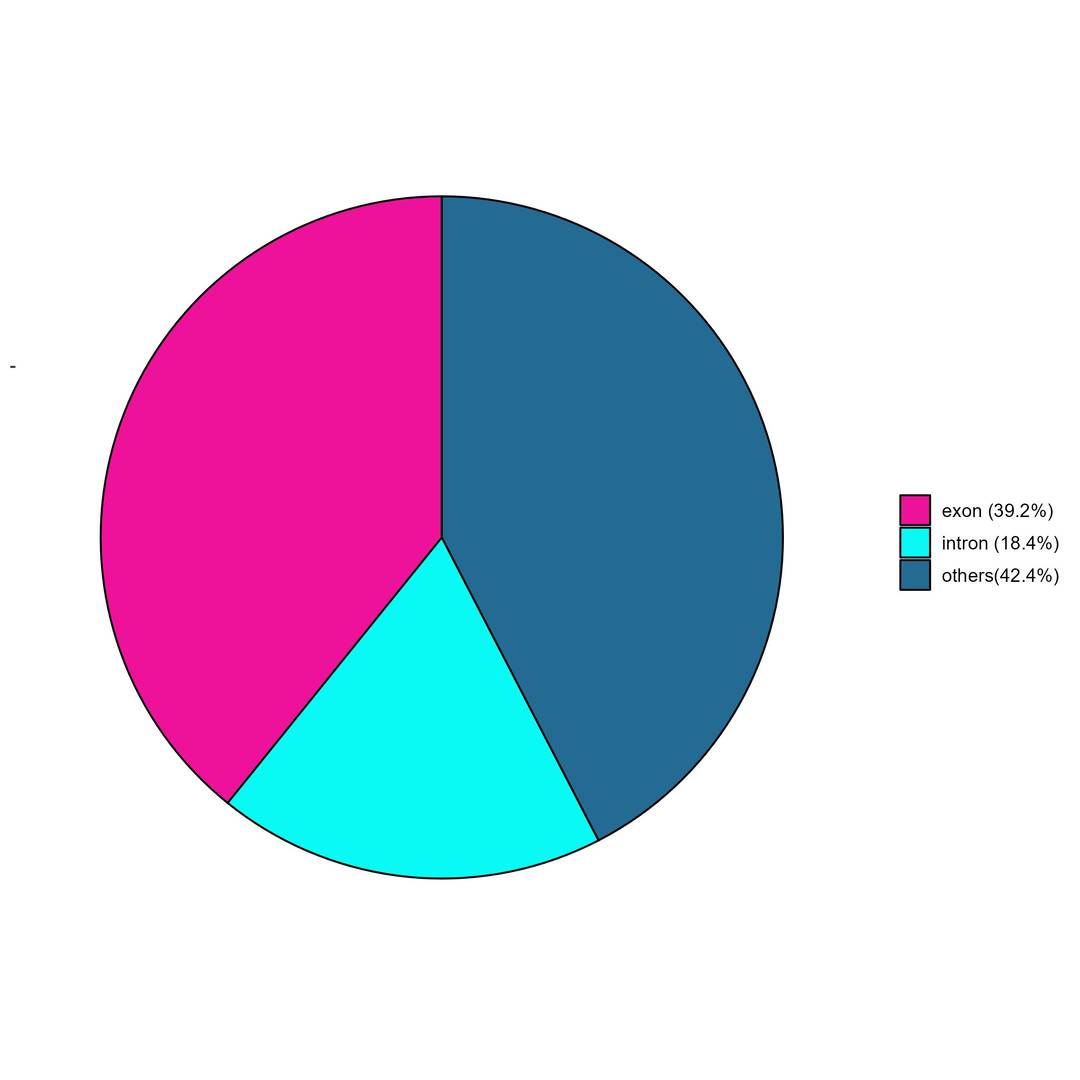 Fig5. Peak annotation distribution.
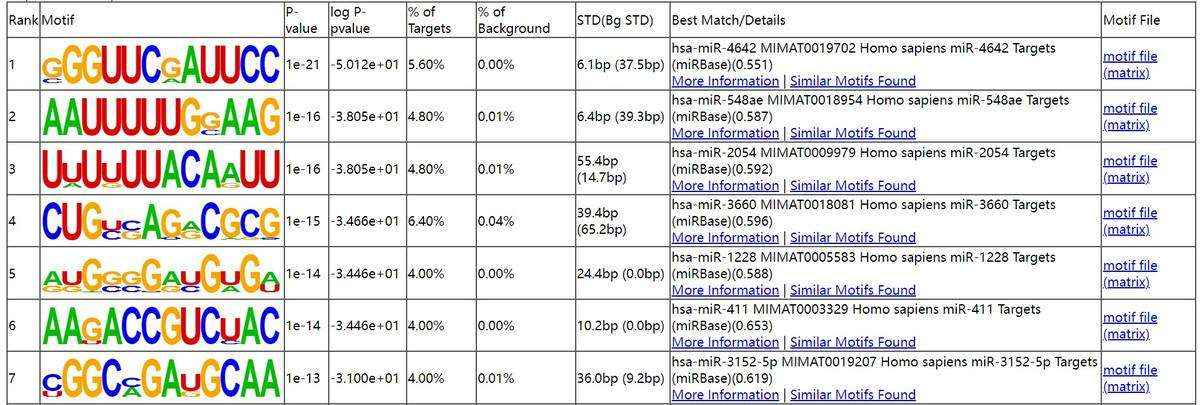 Fig6. Motif analysis.
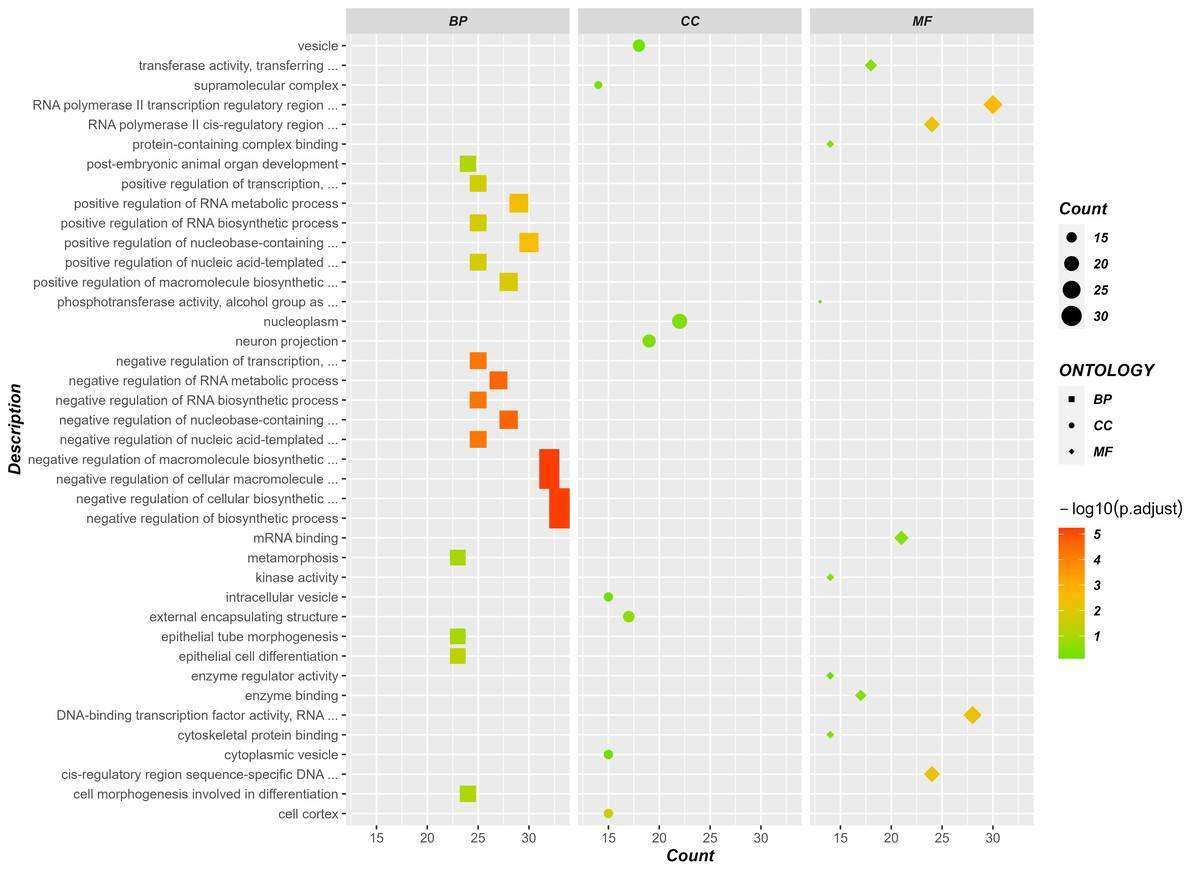 Fig7. GO enrichment analysis diagram.