Protein-DNA interactions are central to gene regulation and cellular functions. Transcription factors bind to DNA to toggle genes on or off, affecting cell development. DNA-binding proteins like histones play vital roles in replication and repair. Traditional methods like ChIP-Seq are crucial but have limitations, requiring large samples and facing signal issues.
To overcome these challenges, innovative methods like ChIP-DIP and SOLiD™ ChIP-Seq have been developed. ChIP-DIP captures multiple protein-DNA interactions, revealing gene regulation networks, while SOLiD™ improves accuracy and reduces sample needs. These advancements make studying protein-DNA interactions more efficient and cost-effective.
CUT&RUN stands for "Cleavage Under Targets and Release Using Nuclease." It's a technique for studying protein-DNA interactions with the following process:
1. Cell Preparation: Cells are fixed to beads, made permeable with a detergent, allowing antibodies to bind to their target proteins.
2. Antibody Binding: Specific antibodies attach to the target proteins for precise localization.
3. Fusion Protein Binding: Protein A or G fused with micrococcal nuclease (pA-MN or pG-MN) binds to the antibody-protein complex to cut nearby chromatin.
4. DNA Cleavage: In the presence of calcium ions, the fusion complex cuts DNA near target proteins, releasing DNA fragments for purification.
5. Sequencing: These fragments are sequenced and aligned to a reference genome to identify protein binding sites. CUT&RUN offers high resolution and low noise, useful for studying transcription factors and histone modifications.
CUT&RUN is easier, cheaper, and works with smaller samples than ChIP-seq, avoiding false positives by skipping crosslinking and sonication, thus improving accuracy.
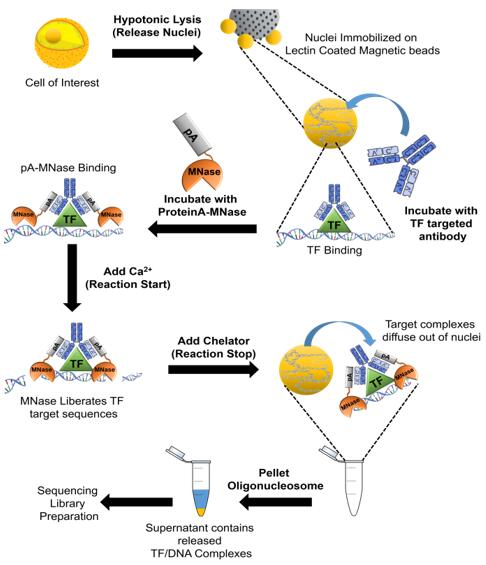 Fig1. Workflow of CUT&RUN-sequencing.
Gene Regulation Studies
CUT&RUN-sequencing is a handy method for checking out how transcription factors and regulatory proteins latch onto DNA, helping us understand how genes are controlled.
Epigenetic Research
This method is key for digging into epigenetic changes and seeing how they tweak gene expression and affect cell behavior.
Disease Mechanisms
CUT&RUN-sequencing can help unravel the molecular roots of diseases by picking apart abnormal protein-DNA interactions.
Drug Discovery
It's useful for spotting possible drug targets and looking at how drugs affect protein-DNA interactions, paving the way for new treatments.
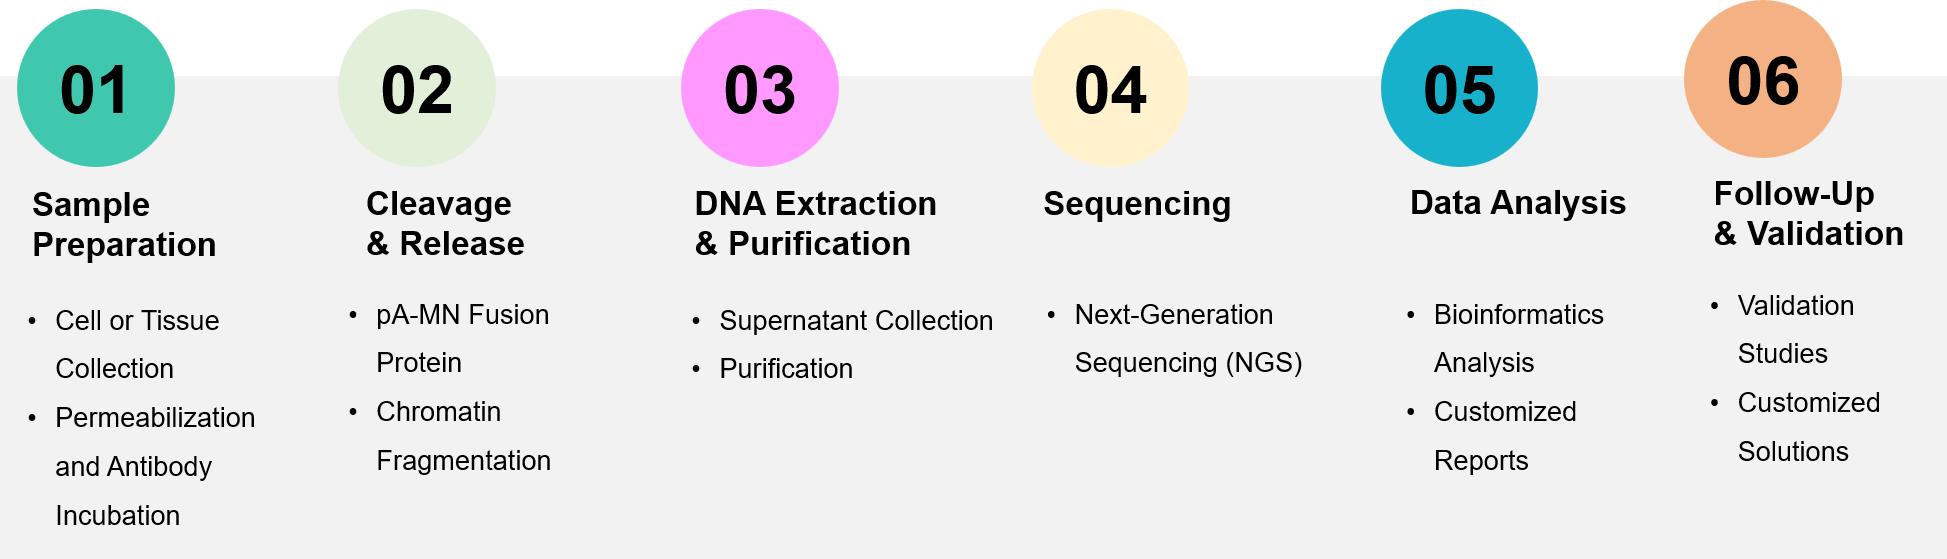
One-Stop Solution
At Profacgen, we offer a full CUT&RUN-sequencing service, handling everything from sample prep to data analysis. Just send us your cell or tissue sample, and we'll take care of the rest for a smooth and easy process.
Professional Bioinformatics Analysis
Our bioinformatics crew is great at making sense of CUT&RUN-sequencing data, using tools like Bowtie2 and deepTools to turn it into insights you can actually use. We tweak our analysis services to match what each project specifically needs, making sure you really get the most out of your data.
High-Quality Results
At Profacgen, we strive to deliver high-resolution data with an excellent signal-to-noise ratio by employing advanced techniques like peak calling and motif analysis. This ensures you can trust the outcomes. Our history of successful projects and outstanding data quality underscores our commitment to delivering top-tier results.
Additional Services:
Background
This project utilizes CUT&RUN sequencing to identify the impact of transcription factors on DNA binding function. The method involves using specific antibodies and pAG-micrococcal nuclease (pAG-MNase) to cleave and release DNA sequences bound to target proteins, obtaining target DNA fragments for sequencing. The DNA samples were provided by the customer, and our work included library generation, sequencing, and bioinformatics analysis.
Data Analysis
Quality control, reads mapping using BWA, peak calling with MACS2, motif analysis using HOMER, peak annotation with ChIPseeker, differential peak analysis using edgeR or DESeq2, TSS enrichment analysis using deeptools-computeMatrix, and target gene GO/KEGG analysis using GOseq R package and KEGG database.
Results
Distribution characteristics around the transcription start site (TSS) were analyzed.
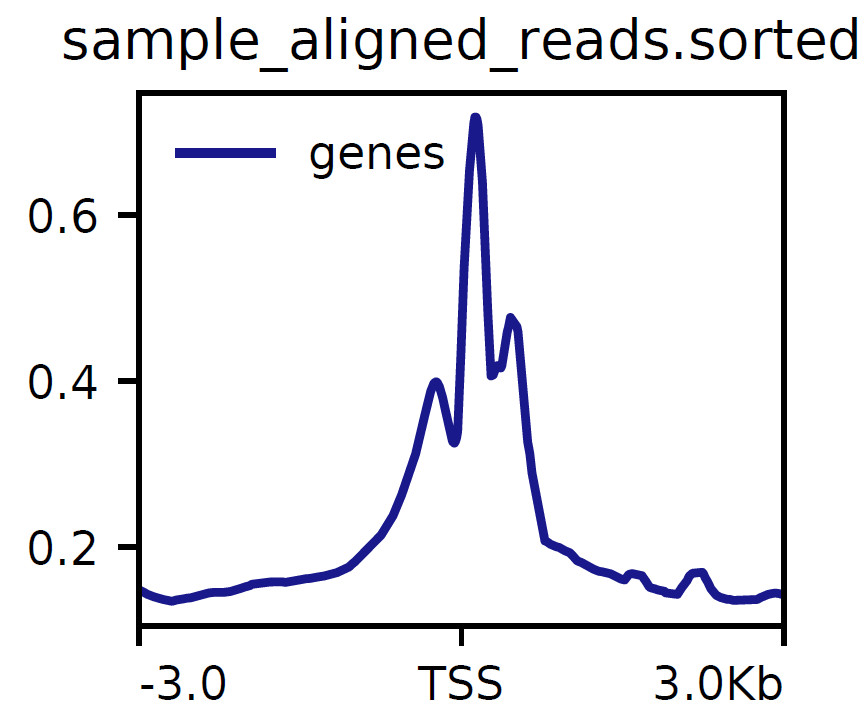 Fig2. Distribution of reads near TSS (Cell line 1-1 sample).
PeakAnnotator identified the nearest TSS of every peak and the distance distribution between peaks and TSS.
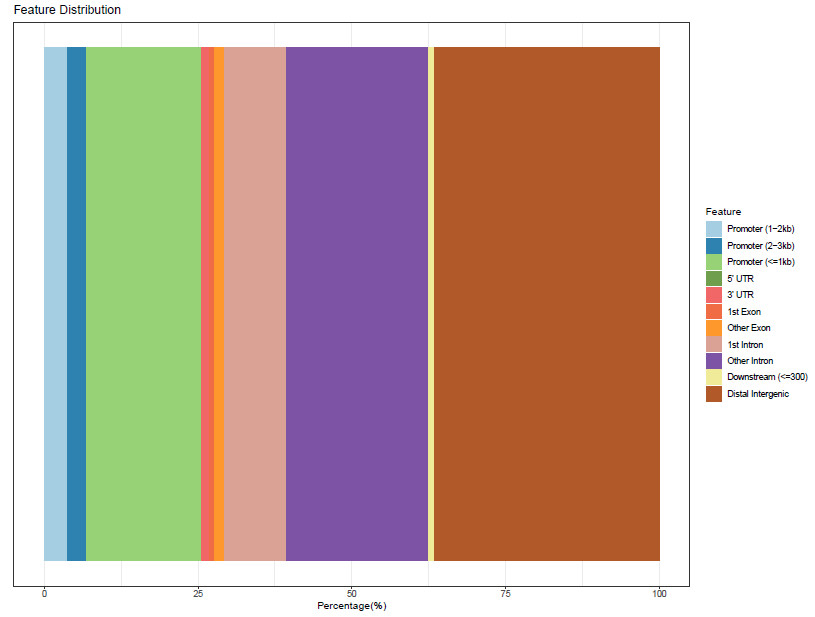 Fig3. Distribution of genomic characteristic regions (Cell line 1-1 sample).
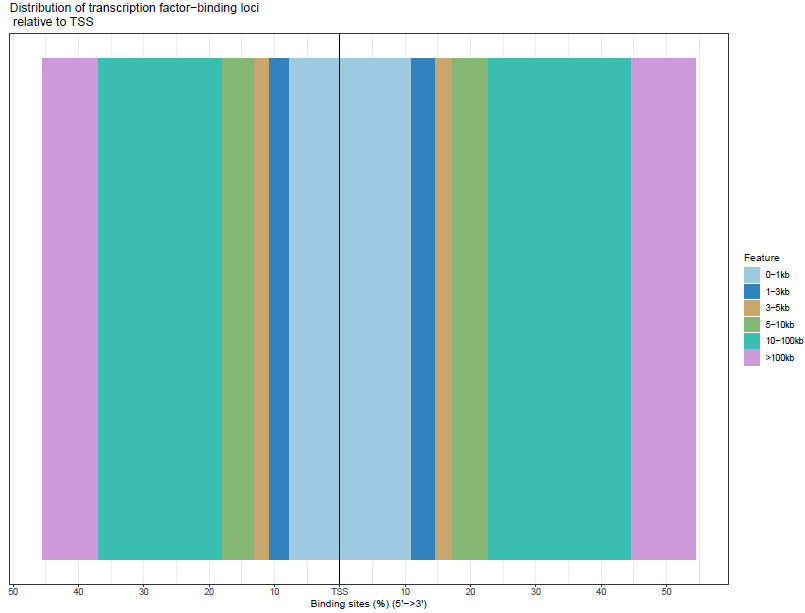 Fig4. Distance from peak to target gene TSS (Cell line 1-1 sample).
FIMO was used to analyze the footprinting of each motif.
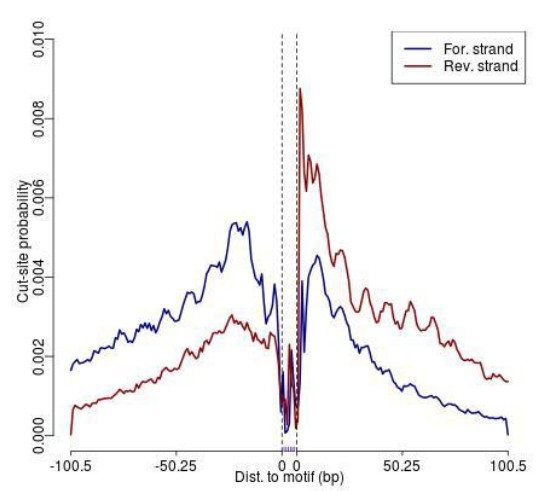 Fig5. Footprinting (example).
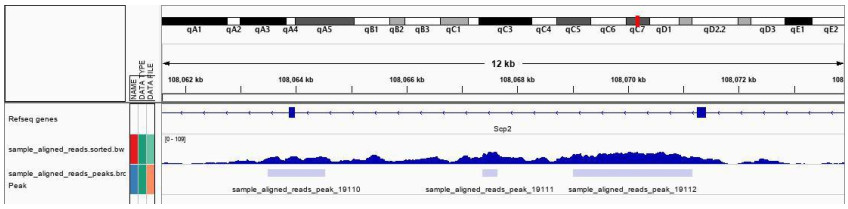 Fig6. IGV view (example).
GO and KEGG analysis identified significantly enriched terms related to the target genes.
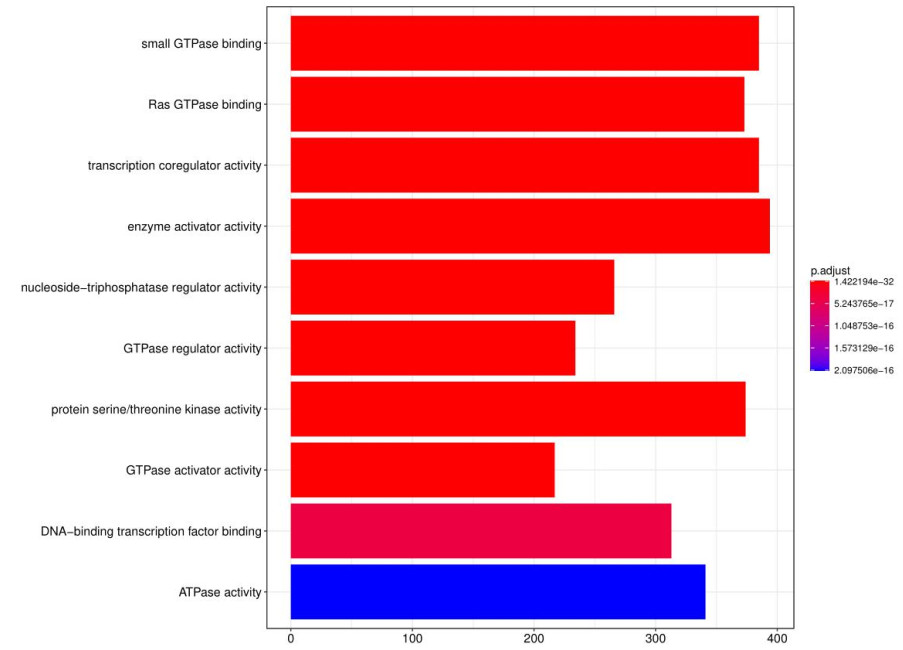 Fig7. GO analysis bar graph.
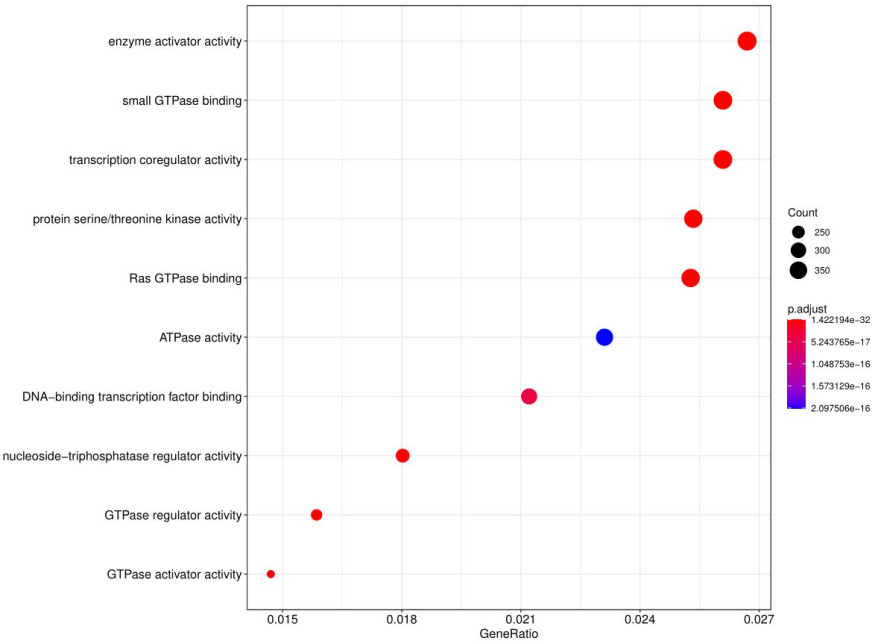 Fig8. GO analysis dot chart.
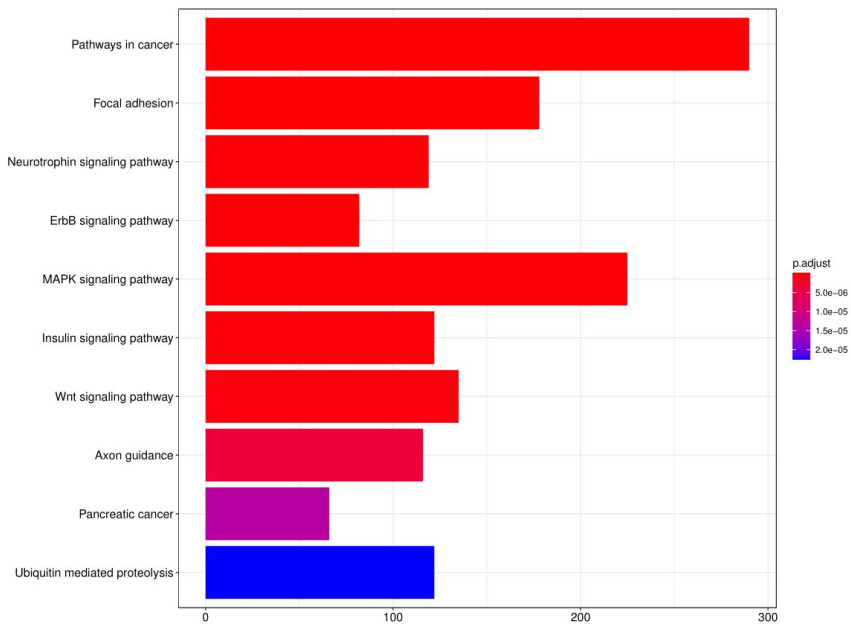 Fig9. KEGG analysis bar graph.
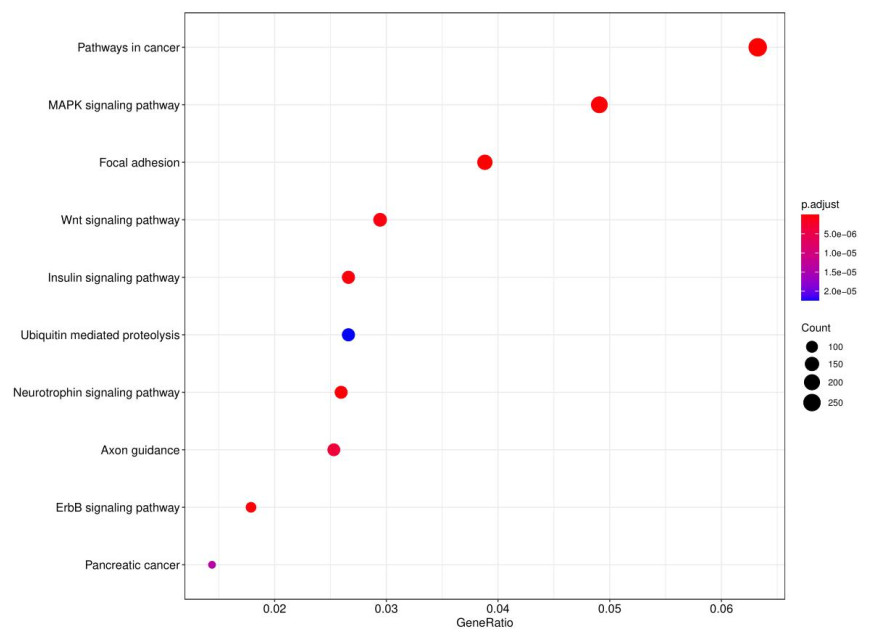 Fig10. KEGG analysis dot chart.
Background
This project employs CUT&RUN sequencing to investigate the binding of transcription factors to DNA. The technique uses specific antibodies and pAG-micrococcal nuclease (pAG-MNase) to cleave and release DNA sequences bound to target proteins, facilitating the analysis of protein-DNA interactions. The DNA samples were provided by the customer, and our work encompassed library generation, sequencing, and bioinformatics analysis.
Data Analysis
Quality control, reads mapping using BWA, peak calling with MACS2, motif analysis using HOMER, peak annotation with ChIPseeker, differential peak analysis using edgeR or DESeq2, TSS enrichment analysis using deeptools-computeMatrix, and target gene GO/KEGG analysis using GOseq R package and KEGG database.
Results
Raw data quality control using FastQC and MultiQC.
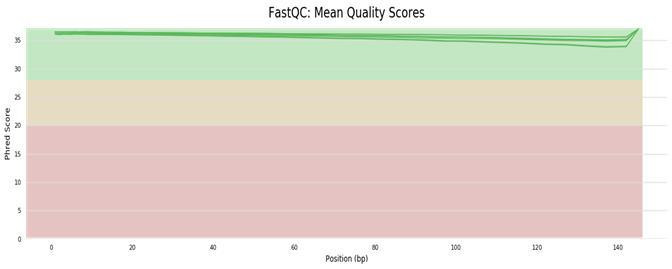 Fig11. Base Quality Distribution.
MACS2 peak finding algorithm identified regions of IP enrichment over background.
Peak statistics showed the number of peaks and FRiP scores.
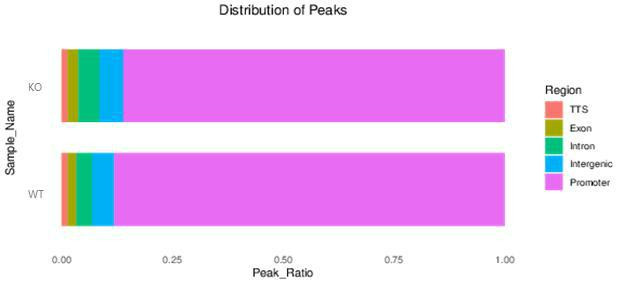 Fig12. Distribution of Peaks.
Differential analysis of peaks using edgeR or DESeq2.
Venn plot showed the overlap of peaks between different groups.
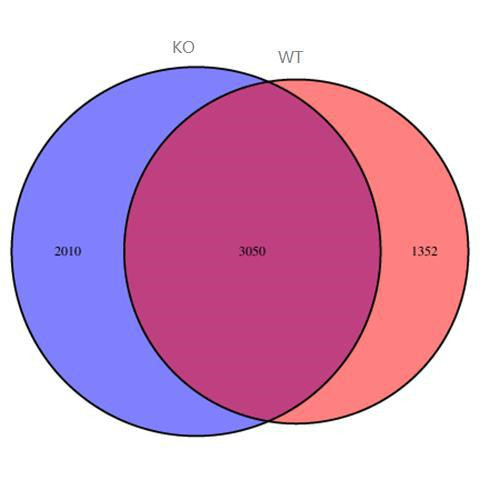 Fig13. Peak Venn Plot.
HOMER was used to find de novo motif sequences.
Motif analysis results were summarized in a table.
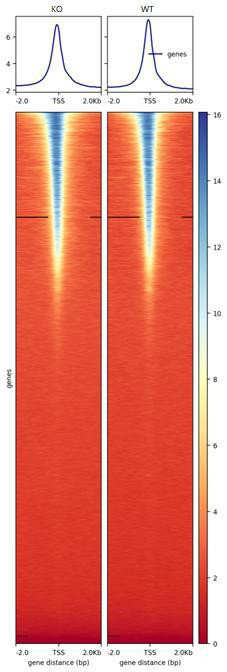 Fig14. Rank 1 Motif.
TSS enrichment heatmap showed the distribution of peaks around TSS.
Genebody enrichment heatmap and TES enrichment heatmap were also generated.
 Fig15. TSS Enrichment Heatmap.
| Chromatin Immunoprecipitation (ChIP) Assay Service | ChIRP-Seq Service | miCLIP-seq | DNase I Footprinting Assay Service | Electrophoretic Mobility Shift Assay (EMSA) Service |
References:
Fill out this form and one of our experts will respond to you within one business day.